
Spot unusual signals and check the right place.
A change in a report may be worth noticing, but it isn't enough to explain the cause. ARIA helps surface increases, decreases and anomalies from your continuously updated operational data, so you can decide where to look and start the conversation sooner.
The numbers have changed, but what to check is still unclear
The friction when the data is there, yet users still need time to read it, understand it and ask the right questions.
Changes get lost among many metrics
When a dashboard carries a lot of information, it's hard to review every change by hand. A notable signal may not get the priority it deserves.
You see something unusual but lack context
A figure that rises or falls may relate to the data period, workload or a special circumstance. Looking only at the size of the change can lead to hasty interpretations.
The data to cross-check lives in many places
Performance, activity and operational reports are tracked in different modules. Managers spend time working out which one to check first.
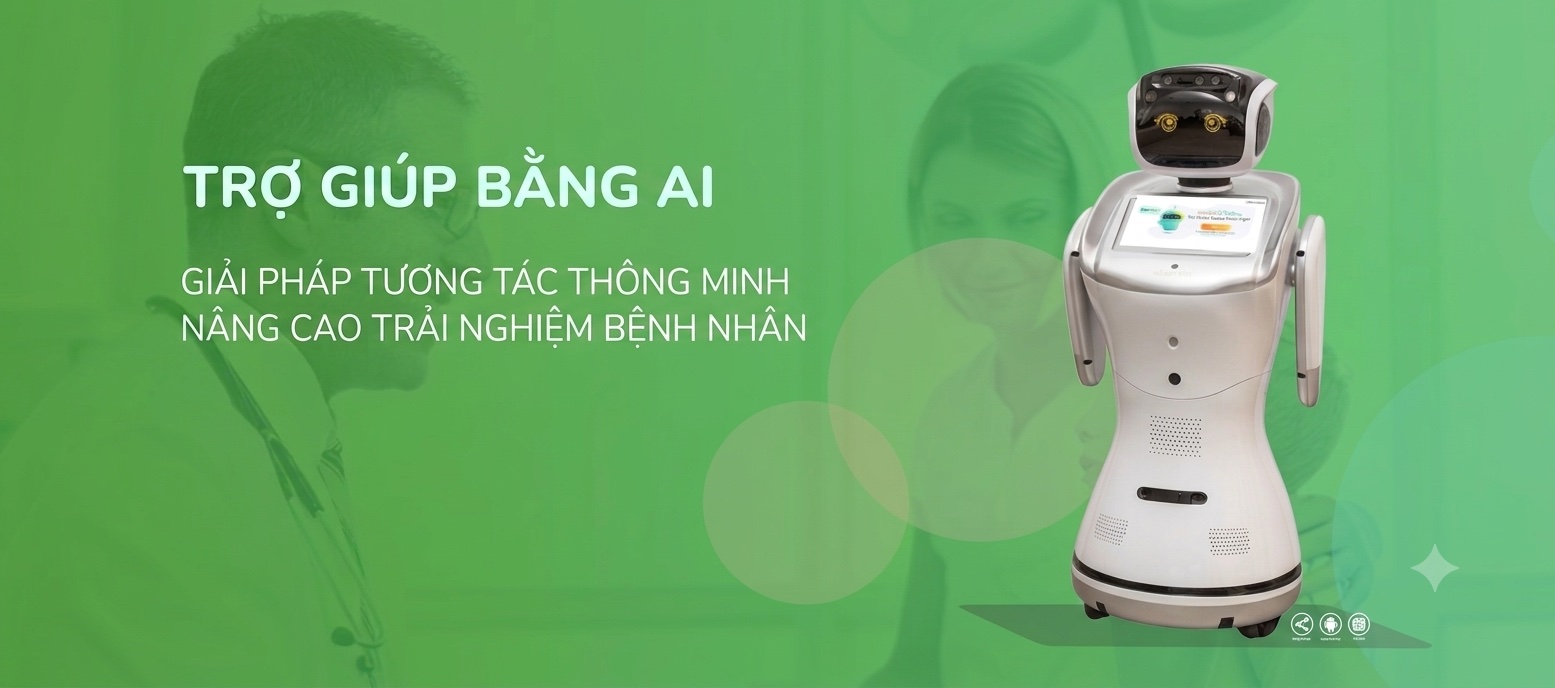
From a notable signal to a focused check
In its report-based insights, ARIA helps point out notable increases, decreases and anomalies. Combined with signals from the modules your business uses, the explanation helps managers define the questions that need answering.
Real-time monitoring should be read alongside the time the source data was last updated. Insights reflect the information available; users still need to check the underlying data and context before confirming a cause or deciding how to respond.
Demo video: Using ARIA to check overdue and upcoming tasks — watch from 00:39
Screenshots taken directly from the DearPulse system
Real interface screenshots will be added in the two placeholders below.
Image slot 01 · AI insight highlighting an anomaly
A screenshot of an AI insight highlighting an anomaly will be added here.
Image slot 02 · Report data for cross-checking the signal
A screenshot of the report data used to cross-check the signal will be added here.
The value for those who monitor operations
Turn data into a clear starting point for checking, discussing and weighing action.
Focus on what to revisit
Use insights to pick the changes worth checking among many metrics. You gain a basis for ordering your review instead of scanning all the data.
Talk sooner and more specifically
A signal tied to a report lets the conversation start with a clear question. Managers can verify what is happening together with the responsible team.
Reduce the risk of unfounded conclusions
View signals alongside the data period, work status and related sources. ARIA helps guide your checks; users confirm before acting.
Anomaly detection with context and verification
Combining report context, signals from your modules and the active role of the manager.
01 · Signals tied to the report you're viewing
Increases, decreases or anomalies are called out in context-aware insights. Users can go back to the related figures to review them.
02 · A view that spans your modules
ARIA can bring together signals from the modules your business uses. Points to cross-check are seen within a broader operational context.
03 · Supports checking, never draws conclusions for people
An unusual signal is a reason to look further. After raising an insight, ARIA does not execute operational changes or make HR decisions.
Tools that help you monitor and clarify anomaly signals
Perspectives that help users read and understand data within the supported feature scope.
Context-aware AI insights
Read the explanation on supported report screens to see which changes in the data you're viewing deserve attention.
Highlights increases and decreases
Clarifies the notable movements in a report. The size of a change should be cross-checked against the data period and the real situation.
Flags anomalies worth a look
ARIA helps point out unusual signals for users to examine further. Insights don't replace the step of verifying the cause.
Multi-module signal summary
Combines information from the modules in use, within supported scope, so managers know where to cross-check the data.
An assistant that explains the numbers
Use ARIA in the admin interface to clarify how to read information or perform related actions when you need to dig deeper.
Suggests what to prioritize
Helps you choose which issue to check first. Users weigh impact, data and ownership to decide the next step.
Check anomaly signals with ARIA in 3 steps
Open the right data, read the insight in context and verify before choosing an action.
01 · Check the data source and timing
Open the report you want to monitor and check the data period and the module's update status. Make sure the insight is read against the right scope of information.
02 · Read the insight and choose what to cross-check
Review the changes ARIA points out, go back to the related metrics and ask the responsible team specific questions.
03 · Verify, then choose how to respond
Cross-check context and real-world information to confirm what needs to be done. The manager decides whether to adjust, support or keep monitoring.
Frequently asked questions
No. A fluctuation can have many causes. Check the data period, the information source and the real situation before drawing a conclusion.
Let an unusual signal start the right check
Book a demo to see how ARIA helps you spot notable changes and read operational data in context.