
Understand how your team is evolving to choose what to improve.
A score tells you where things stand at one moment; the trend across periods helps you ask deeper questions. ARIA helps read performance data in natural language, highlights notable changes and connects related signals so managers can prepare for conversations, checks and adjustments.
You know the numbers are shifting, but not where to look
The friction when the data is there, yet users still need time to read it, understand it and ask the right questions.
One moment rarely tells the whole story
A rise or dip in one period may reflect a temporary swing in workload. Looking only at the current score makes it hard for managers to see trends that deserve a closer watch.
Reading trends takes time to piece together
When several groups of metrics change at once, managers have to read and interpret them on their own to prepare for a conversation. What matters can get buried in tables of numbers.
Team context is easy to overlook
Progress, collaboration schedules and task requirements can all shape how performance should be read. Without cross-checking, improvement efforts can miss the reality on the ground.
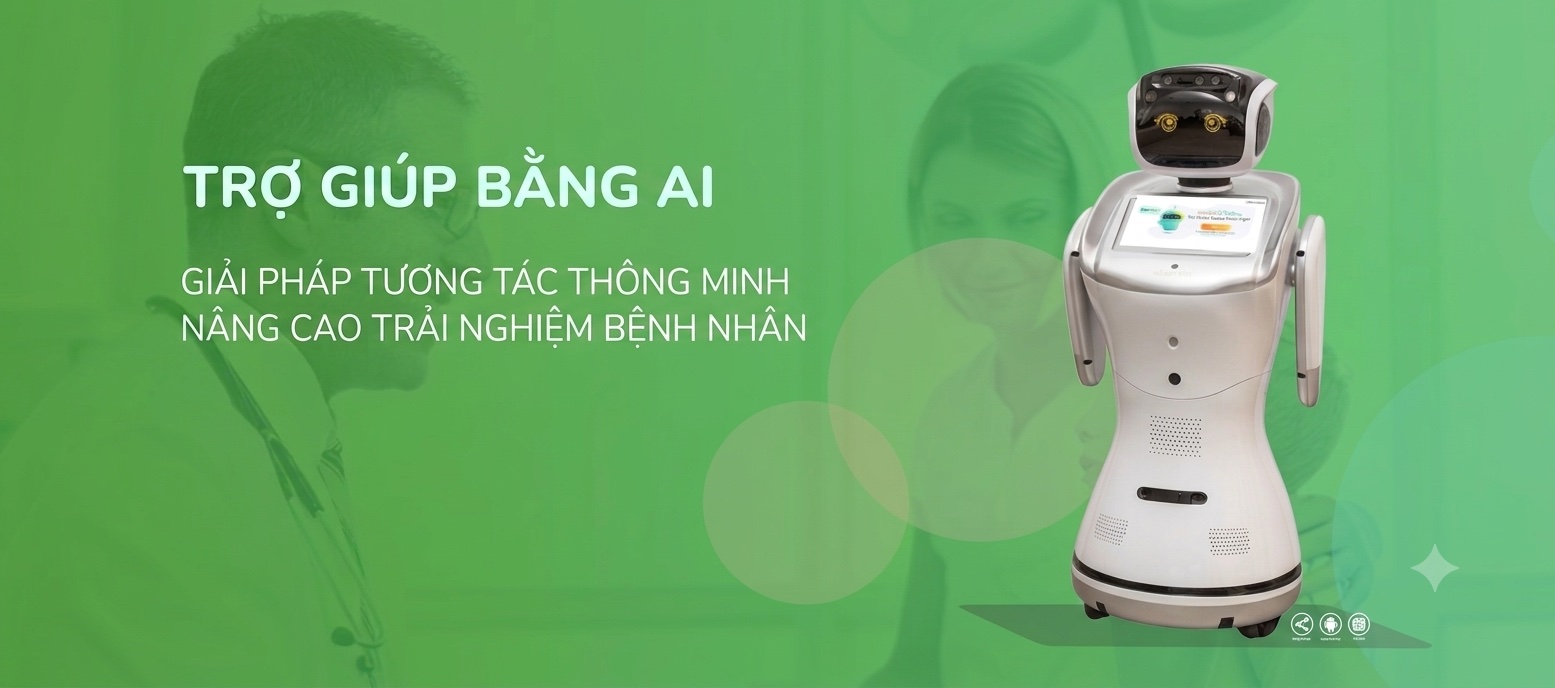
Read trends as a starting point for conversation
ARIA helps summarize performance data and highlight notable changes in reports. Combined with signals from the modules your business uses, managers get another perspective to choose what to examine closely and discuss with the team.
Trends should be read alongside the data period, the evaluation formula and the actual state of tasks. AI insights help guide your checks; results, quality and human feedback are still the information to cross-check before you choose an adjustment.
Demo video: Pulse Coach helps you read team data and balance workload
Screenshots taken directly from the DearPulse system
Real interface screenshots will be added in the two placeholders below.
Image slot 01 · AI insight on performance data
A screenshot of an AI insight on performance data will be added here.
Image slot 02 · Team performance report and trends
A screenshot of the team performance report and its trends will be added here.
The value for managers and teams
Turn data into a clear starting point for checking, discussing and weighing action.
Follow trends with focus
Start from the explanation to pick the changes worth revisiting. You gain a basis for preparing questions instead of scanning every metric before each conversation.
Ask questions that fit the context
View fluctuations alongside workload, progress and real collaboration rhythm. It keeps the conversation on what needs clarifying and the support people need.
Improve with direction
Use insights to prioritize what to check, then cross-reference data and feedback. You have a basis for choosing the right adjustment instead of reacting to a single up or down period.
A trend view tied to your team's operating context
Combining report context, signals from your modules and the active role of the manager.
01 · Data explained right inside the report
AI insights appear in context on supported screens. Managers read the key points and go back to the related metrics as they review.
02 · Signals connected across the modules in use
ARIA can bring together performance signals and supported operational sources. The broader view helps identify which data to cross-check before concluding.
03 · Leads to conversation and verification
AI helps summarize, call out changes and suggest priorities. The decision to adjust collaboration or manage the team stays with people.
Tools that help you read team performance trends
Perspectives that help users read and understand data within the supported feature scope.
Insights based on performance reports
Read the data explanation on supported screens. Confirm the data period you're viewing to keep trends within the right scope.
Easy-to-understand trend summaries
ARIA uses natural language to present the key points, helping managers grasp the situation before drilling into each metric.
Highlights notable changes
Increases, decreases or unusual movements are a basis for choosing what to cross-check across periods. Fluctuations should be read in the context of related work.
Related signals brought together
Combines information from the modules your business uses, within supported scope. You gain another perspective for asking questions about operations.
Help explaining the numbers
ARIA in the admin interface can help clarify information or how to perform an action, so users can continue reviewing related reports.
Suggests what to review first
Points you to what to check first so you can prepare for team conversations. Managers verify the data and choose the right way to improve.
Read performance trends with ARIA in 3 steps
Open the right data, read the insight in context and verify before choosing an action.
01 · Define the right period and data scope
Open the relevant performance report and check the data period and the team context you're tracking. Clarify the question you want to answer before reading the insight.
02 · Read the key points and cross-check the trend
Review the changes ARIA points out, go back to the related metrics and compare them with task status, progress and the team's collaboration rhythm.
03 · Talk it through and follow up after adjustments
Verify with the responsible person, choose what to improve and look again in the following periods. Use data to support the conversation, not to replace it.
Frequently asked questions
The current content describes summarizing and analyzing signals and trends in the data. Insights should not be taken as a firm forecast of future results.
Let every change in the data open a clearer conversation
Book a demo to see how ARIA helps you read performance trends and prioritize what to examine with your team.