
From tables of numbers to key takeaways, right in the report you're viewing.
You don't always have time to read every number before a meeting. ARIA summarizes data in natural language and highlights notable changes, so you can grasp the situation, choose what to explore further and prepare more focused conversations.
The report is there, but what deserves attention is still hard to see
The friction when the data is there, yet users still need time to read it, understand it and ask the right questions.
Lots of numbers, little time to prepare
Every screen carries many metrics and charts. When you need a quick read on the situation, it's easy to miss what needs revisiting or to spend too long on each table.
You have to interpret before you can discuss
Rising and falling figures don't tell you what to prioritize. You often have to synthesize and put them into words before you can discuss them with your team.
Context is easily lost when switching tools
Reading a report in one place and interpreting it in another means re-explaining what you were looking at. Your preparation gets split across many steps.
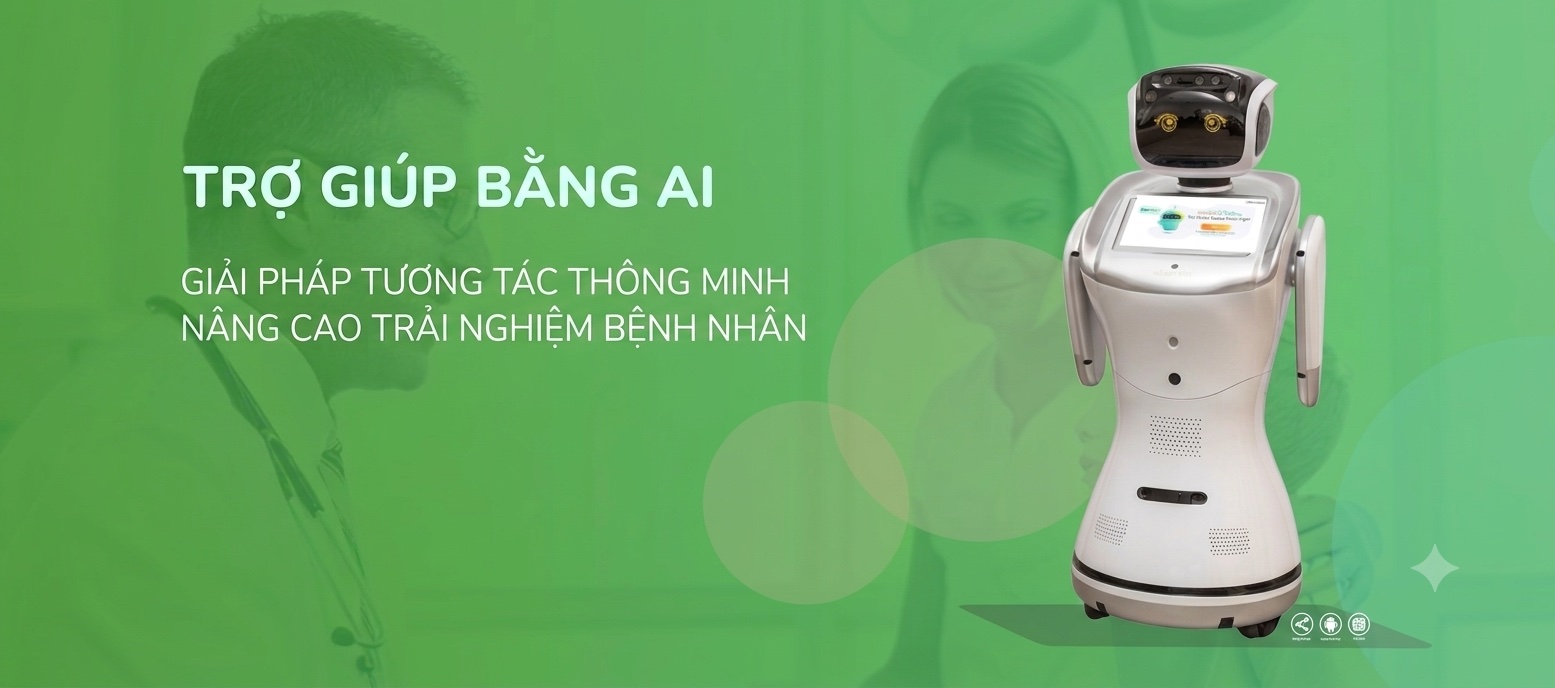
Read the key points first, dive deeper when you need to
On screens with the AI Insights button, ARIA summarizes the figures in the report you're viewing and calls out notable increases, decreases or anomalies. Start with the explanation to see which metrics to go back and examine.
Insights are tied to the report's context, keeping conversations anchored in specific data. ARIA supports how you read and prioritize; users still need to cross-check the original figures, the reporting period and the operational context before deciding.
Tutorial video: Ask ARIA to summarize and look up data
Screenshots taken directly from the DearPulse system
Real interface screenshots will be added in the two placeholders below.
Image slot 01 · AI Insights on the report screen
A screenshot of AI Insights on the report screen will be added here.
Image slot 02 · The summary and notable points
A screenshot of the summary and notable points will be added here.
The value for those who read and present reports
Turn data into a clear starting point for checking, discussing and weighing action.
Get the key points faster
Start with an easy-to-read summary instead of interpreting every table yourself. You gain a basis for deciding what to check before a meeting.
Hold more focused conversations
Use notable changes to prepare questions and discussion points. Your team has a clear starting point when reviewing a report together.
Keep context while you analyze
Insights appear right on the relevant screen. You can go back to the figures to verify and see details as you read.
Insights tied to the report and context you're viewing
Combining report context, signals from your modules and the active role of the manager.
01 · Right there in the report
The AI Insights button appears in context on supported screens, such as the order overview or the cash ledger. Users read the summary right where they work with the numbers.
02 · Data explained in a way that's easy to discuss
ARIA presents the key points in natural language and highlights what stands out. The explanation helps readers choose what to examine further.
03 · People keep the final say
AI helps summarize and suggest what to prioritize. Verifying, discussing and choosing an action remain with the manager, with no automatic operational changes.
Tools that help you read and understand reports in context
Perspectives that help users read and understand data within the supported feature scope.
Report-based insights
Click AI Insights on a supported screen and ARIA summarizes the figures you're viewing. The content is read alongside the related report.
Natural-language summaries
Turns a report's main points into an easy-to-read explanation, helping users grasp the situation before diving into each metric.
Highlights increases and decreases
Brings out the notable changes in report data so users can choose what to cross-check and review.
Suggests what to prioritize
Helps identify which issue to check first. Suggestions should be read alongside your business goals and real-world situation.
An assistant that explains the numbers
ARIA is available in the admin interface to explain figures or guide you through actions whenever you need clarification.
A view across the modules in use
Can bring together signals from the multiple modules your business uses. The depth of analysis depends on the available data and feature scope.
Understand your reports with ARIA in 3 steps
Open the right data, read the insight in context and verify before choosing an action.
01 · Open the report you need
Check the data period and the content of the relevant screen. Define the question you need answered before reading the insight.
02 · Click AI Insights
ARIA summarizes the figures you're viewing and highlights what stands out. Read the key points to choose which metrics to cross-check or explore further.
03 · Verify and prioritize action
Go back to the original data, talk with the person responsible and place the insight in its operational context. The manager decides the next step.
Frequently asked questions
On supported report screens that have the AI Insights button, such as the order overview or the cash ledger. ARIA is also available in the admin interface to support users.
Start every report with clear key takeaways
Book a demo to see how ARIA helps you read reports in context and prepare more focused conversations.