In its 2025 Workforce Utilization Benchmarks report, the ActivTrak Productivity Lab analysed the digital activity data of 304,083 workers across 5,619 organisations. The study reveals a gap between the target for productive work and the time recorded on applications and websites classified as work-related. This is a dataset with a defined scope, not a calculation based on figures a business made up for itself [1][2].
In 2025, the ActivTrak Productivity Lab published an eye-catching figure: in their research sample, average productive working time fell short of the stated target by about 54 minutes per person per day. From there, they estimated a productivity gap worth some USD 11.2 million a year per 1,000 employees [1].
That number has enormous marketing appeal. But a responsible manager needs to ask the follow-up questions: "How were those 54 minutes measured? Is every employee really wasting 54 minutes? Is USD 11.2 million money the business could actually save?"
This article examines the methodology, its limits, and how Vietnamese businesses can calculate a more conservative version of the workforce capacity problem.
1. What data does ActivTrak use to measure the "capacity gap"?
In the Workforce Utilization Benchmarks report published on 30 July 2025, ActivTrak analysed the digital activity data of 304,083 workers across 5,619 organisations, focusing on May 2025. The study uses the productive-hours targets set by each organisation and compares them with the time recorded on software and websites [1][2].
The published results: 58% of the workers in the sample fell below their productive work target; the average target was around 6 hours 50 minutes a day, while the average recorded level was about 5 hours 56 minutes a day. The gap is 54 minutes per person per day, equivalent to roughly 13% of the target. ActivTrak interprets this as businesses receiving 87% of the expected productive activity time under their model [2].
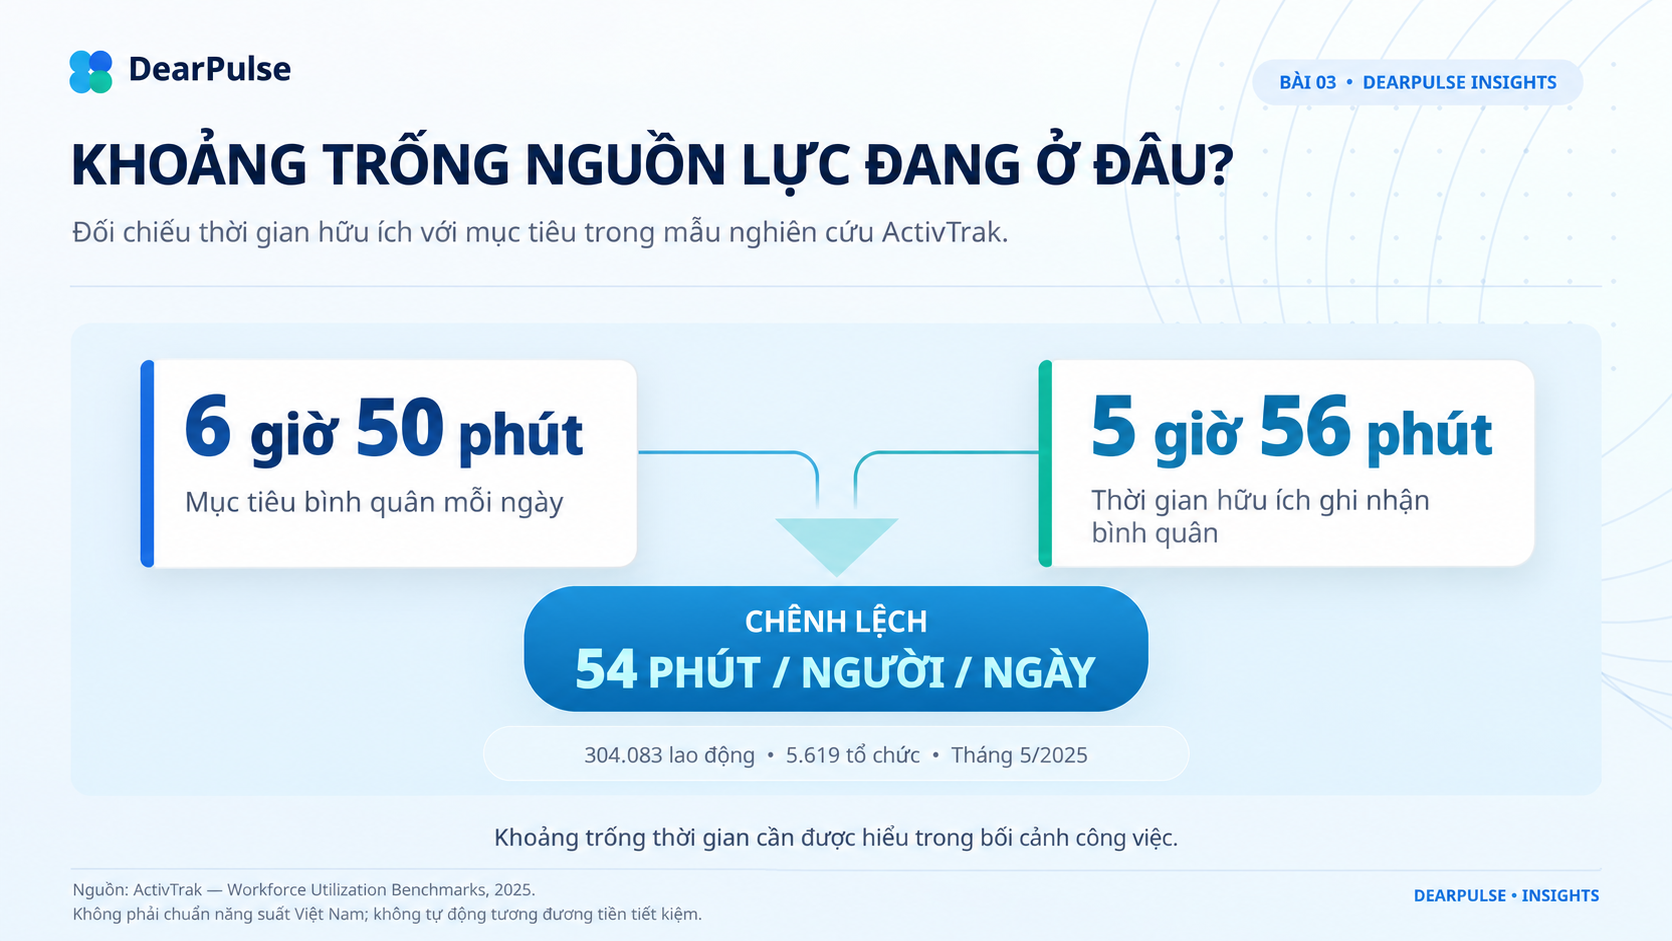
Targets versus recorded productive time in the 2025 ActivTrak research sample.
Three limitations need to be made clear straight away.
First, the 6-hour-50-minute target is not a mandatory productivity standard for every occupation. Each company classifies applications and sets targets differently; work done away from a computer may not show up in full.
Second, time spent in applications classified as productive is not business output. An employee may spend less digital time yet produce higher-quality output, or may be taking reasonable breaks that keep their performance sustainable.
Third, results from ActivTrak's customer sample are not representative of Vietnamese businesses. You cannot write "Vietnamese employees lose 54 minutes a day" without a properly qualified study of your own.
2. How is ActivTrak able to arrive at a figure of USD 11.2 million?
ActivTrak uses a model that converts the value of productive working time below target into labour cost. For 1,000 employees, an average gap of roughly 13% equates to 130 full-time equivalents under their reference formula. The company uses an average salary of USD 85,864 a year for the industries included in the model, producing a figure of approximately USD 11.2 million a year [1].
This is an estimate of untapped capacity value, not cash that has already been lost or that could be recovered immediately. In practice, payroll savings only materialise if a change genuinely reduces labour cost; if employees use the freed-up time to do more valuable work, the benefit may show up in revenue, quality or responsiveness rather than in lower salary payments.
The calculation also tells you nothing automatically about whether a position could be cut. If the work of the "under-loaded" people is reserve capacity for peak season, customer support cover or mandatory compliance, low capacity utilisation at the moment of observation may be exactly what is needed.
Rather than jumping to the conclusion that "58% of employees are underperforming", it is better to ask: Are the targets appropriate for each role? Does the business have enough value-creating work to allocate? And is the process leaving resources idle or scattered?
3. MedRisk: what financial figures have actually been published?
MedRisk is an organisation that manages physical rehabilitation services related to workers' compensation and accident insurance in the United States. According to the ActivTrak case study, by 2024 the organisation had more than 3,200 employees operating across multiple business units following a series of acquisitions [5]. Its leadership lacked a consistent view of activity time, workload and resource needs across those units.
MedRisk rolled out ActivTrak level by level through its management structure, using activity data at organisation and team level to examine capacity differences, processes in need of improvement and outsourcing costs. In the case study, one customer service team was found to be relying on Notepad because the line-of-business software lacked a built-in note function; that finding led to a redesign of their working interface [5].
On the financial side, a MedRisk representative said the organisation's estimated annual loss-cost metric had at one point stood at around USD 7 million, and subsequently fell to around USD 3 million. The case study also reports around USD 3 million in labour cost savings and an ROI of roughly 11x [5]. These are separate measures as published by MedRisk and ActivTrak; they must not be added together or treated as cash already recovered.
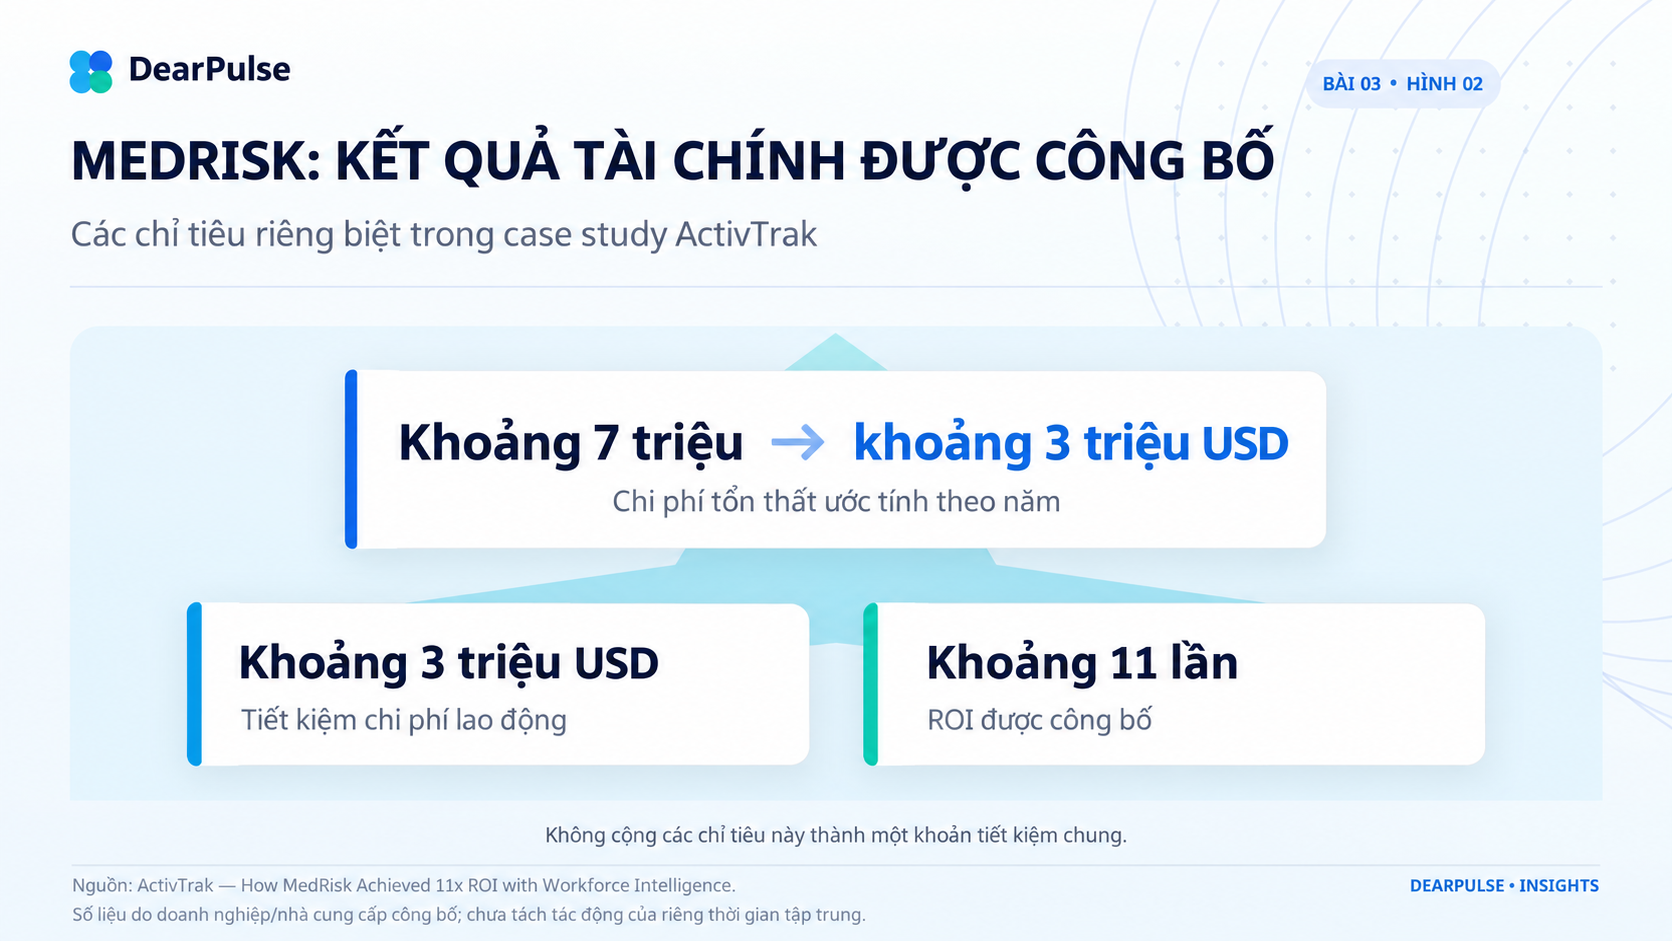
The distinct financial metrics MedRisk published in the ActivTrak case study.
The source does not publish an experiment isolating the impact of focus time alone; the changes were also tied to resource management, working tools and how complete the collected data was. It therefore cannot be concluded that the entire financial result came from deep work.
MedRisk's approach also shows where the line has to be drawn when carrying a case study over to the Vietnamese market: the figures belong to one organisation in a US context and were published by the vendor; they must not be treated as a benchmark for every Vietnamese business.
4. The capacity gap is not in a single place
There are at least four very different kinds of gap.
Not enough work that matches people's skills: employees have available time but have not been assigned suitable work. The solution is coordination and training, not assuming employees are lazy by default.
Too much low-value work: employees are busy with data entry, duplicate reports, hunting for information or status meetings. The solution may be standardisation, automation or cutting unnecessary reporting requirements.
Not enough stretches of focus: employees have plenty of important tasks, but their day is chopped up by a constant stream of requests. The solution is to protect focus time appropriately for each role and validate it against work quality.
Process bottlenecks: employees finish their part but then have to wait for approval, for documents or for a handover; resources get stuck even though everyone's calendar looks full. The solution is to improve the process, not simply to demand that each individual go faster.
These types of gap can coexist in a single business. One department may even be overloaded while another lacks work. Company-wide averages therefore easily hide bottlenecks; analysis needs to be broken down by role group and department, with appropriate thresholds.
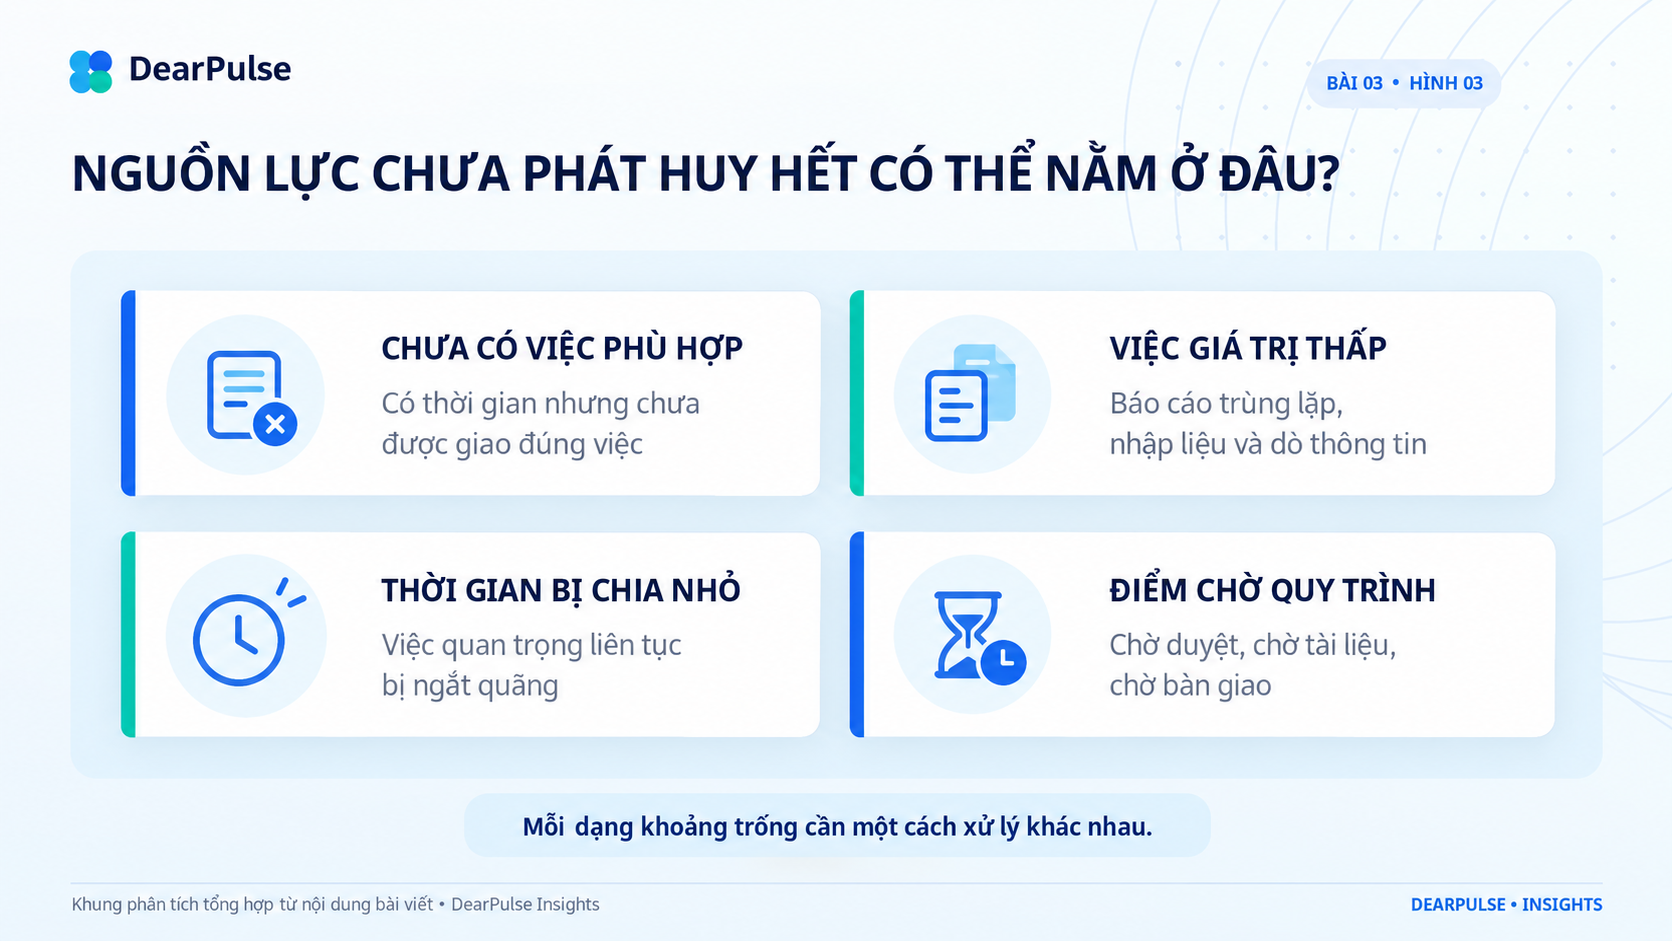
Four kinds of resource gap, each requiring a different response.
5. What have real companies done with capacity data?
The case of Parts ASAP, a supplier of agricultural and industrial parts in North America, shows a broader application of this data. In the ActivTrak case study, the company used the activity analytics platform together with HR data and Power BI to monitor its departments after merging several businesses [3].
According to the vendor's published account, after four months of deployment Parts ASAP recorded an 18% rise in overall productivity, a 42% drop in unproductive time and around 12,000 additional productive working hours per month. The case study also cites an economic benefit of USD 6.82 million and an ROI of 122x under the vendor's own calculation method [3].
That said, these results came from many optimisation activities running at once: coaching employees, standardising tools, performance management and operational adjustments after the mergers. They do not prove that increasing focus time on its own generated USD 6.82 million. The source is also vendor material, not an independent audit.
The lesson worth taking away is the move from measuring activity to making decisions: which team needs support, which process needs changing, which tools overlap, and how the time that gets freed up can be used.
6. How should the capacity gap mindset be applied in DearPulse?
With DearPulse, the appropriate approach is to compare resources against work using data on time, performance, tasks and progress [4]. Instead of assuming a saving is already there for the taking, a business needs to identify the specific bottleneck, trial an adjustment and measure the result again.
At the individual level, work data shows the tasks assigned, what is due and the results achieved. Activity data can help raise questions about how time is allocated, but it should not be used to automatically score someone's capability based on minutes of computer use.
At the team-lead level, data on volume, completion rate and progress helps distinguish someone who is genuinely overloaded from a case where a task is late because of a dependency or a change in requirements.
At the department level, managers can compare labour cost, full-time equivalents, output meeting standard and the relevant work metrics. If some of those metrics are not yet stored or reported automatically by DearPulse, they can be compiled alongside other source data during the assessment phase; they should not be presented as existing features.
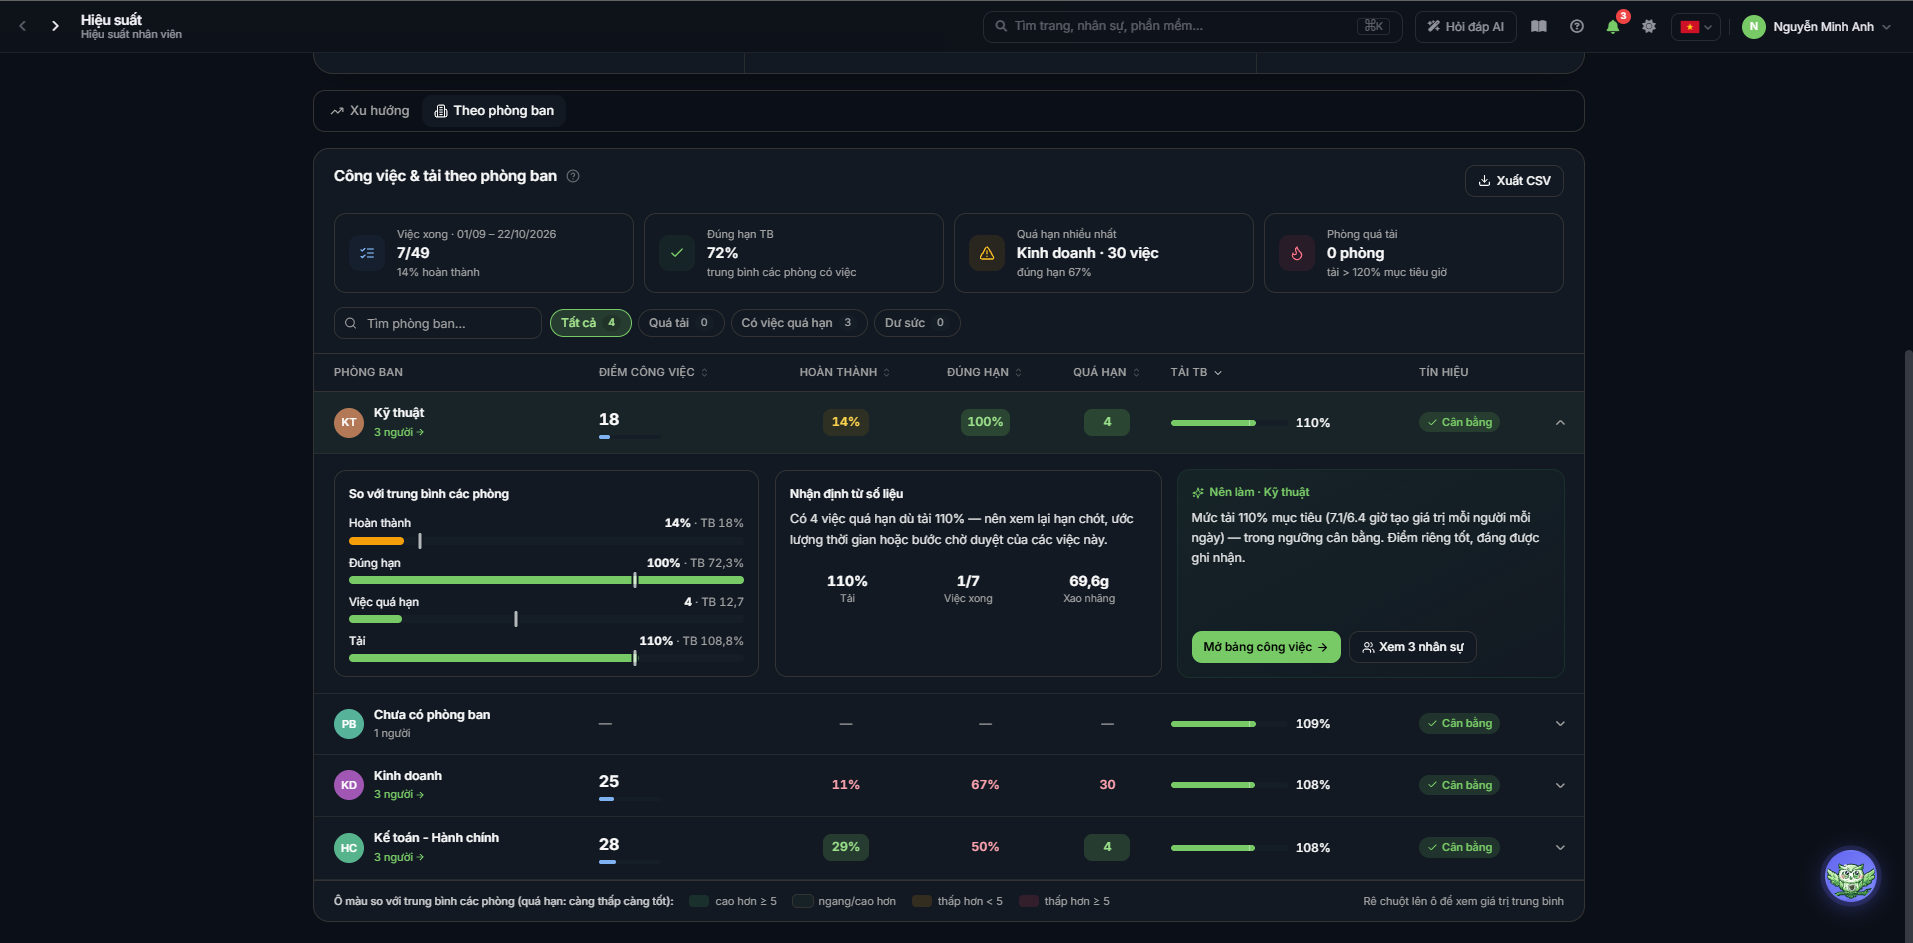
Comparing load, completion and on-time delivery by department to raise questions about bottlenecks.
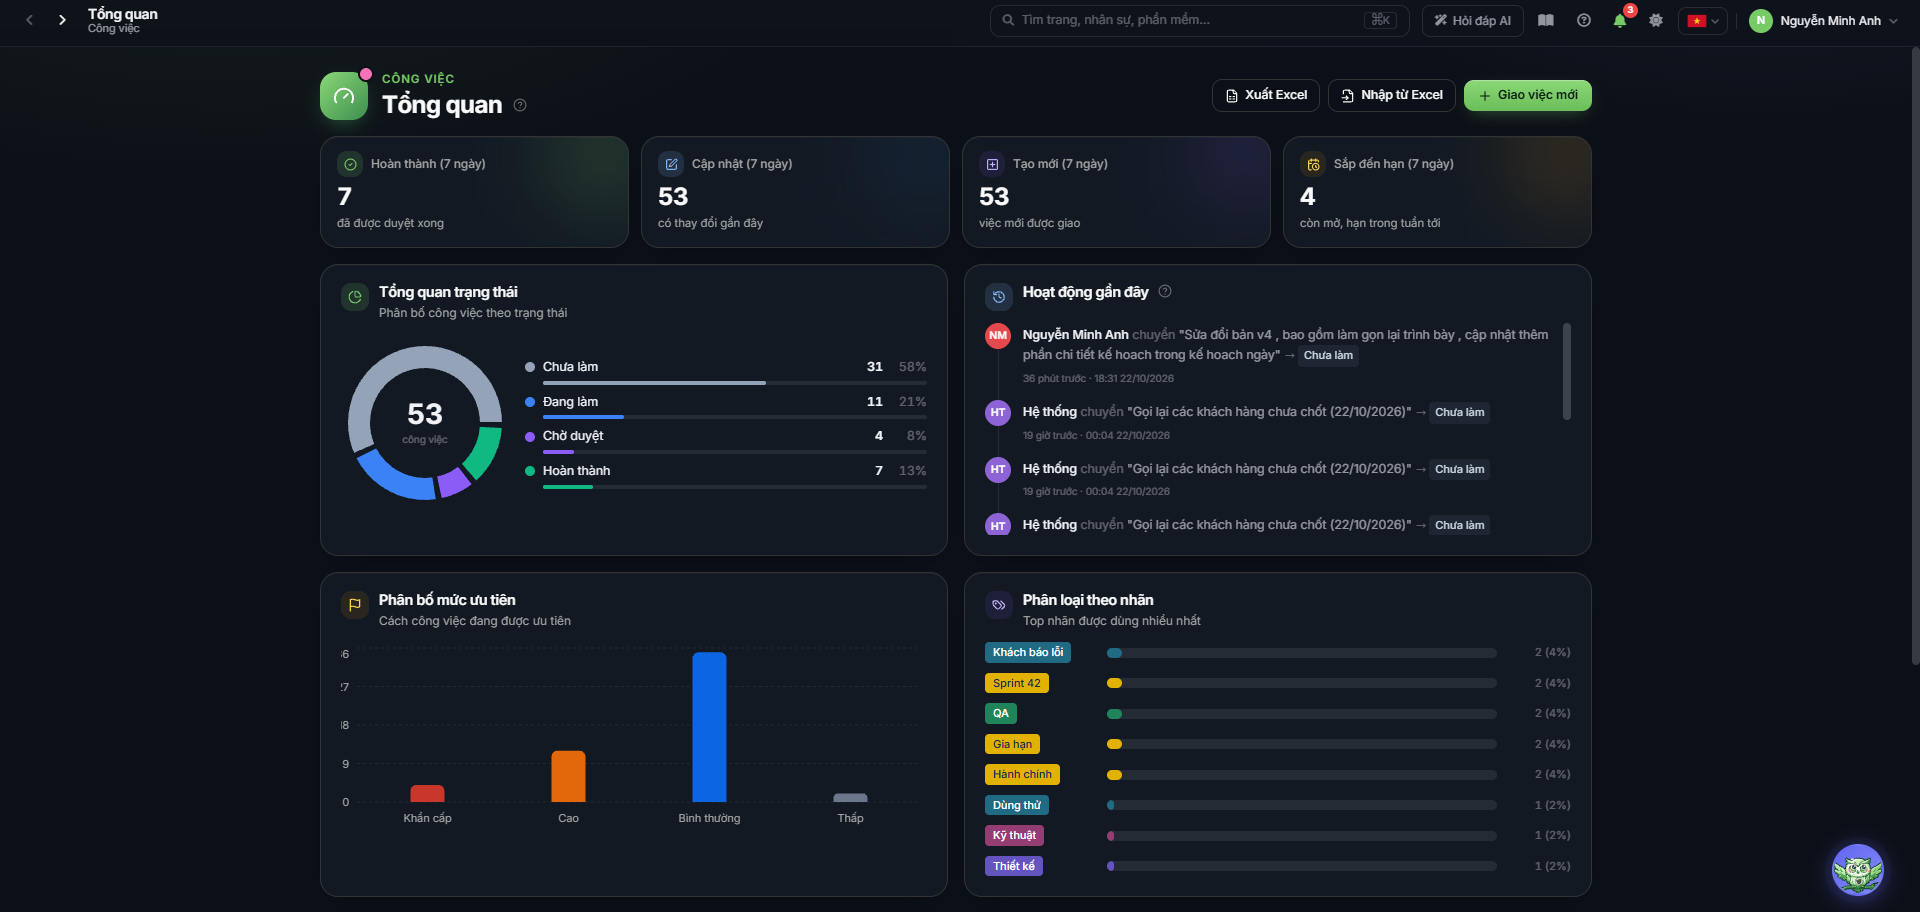
An overview of work created, updated, completed and coming due.
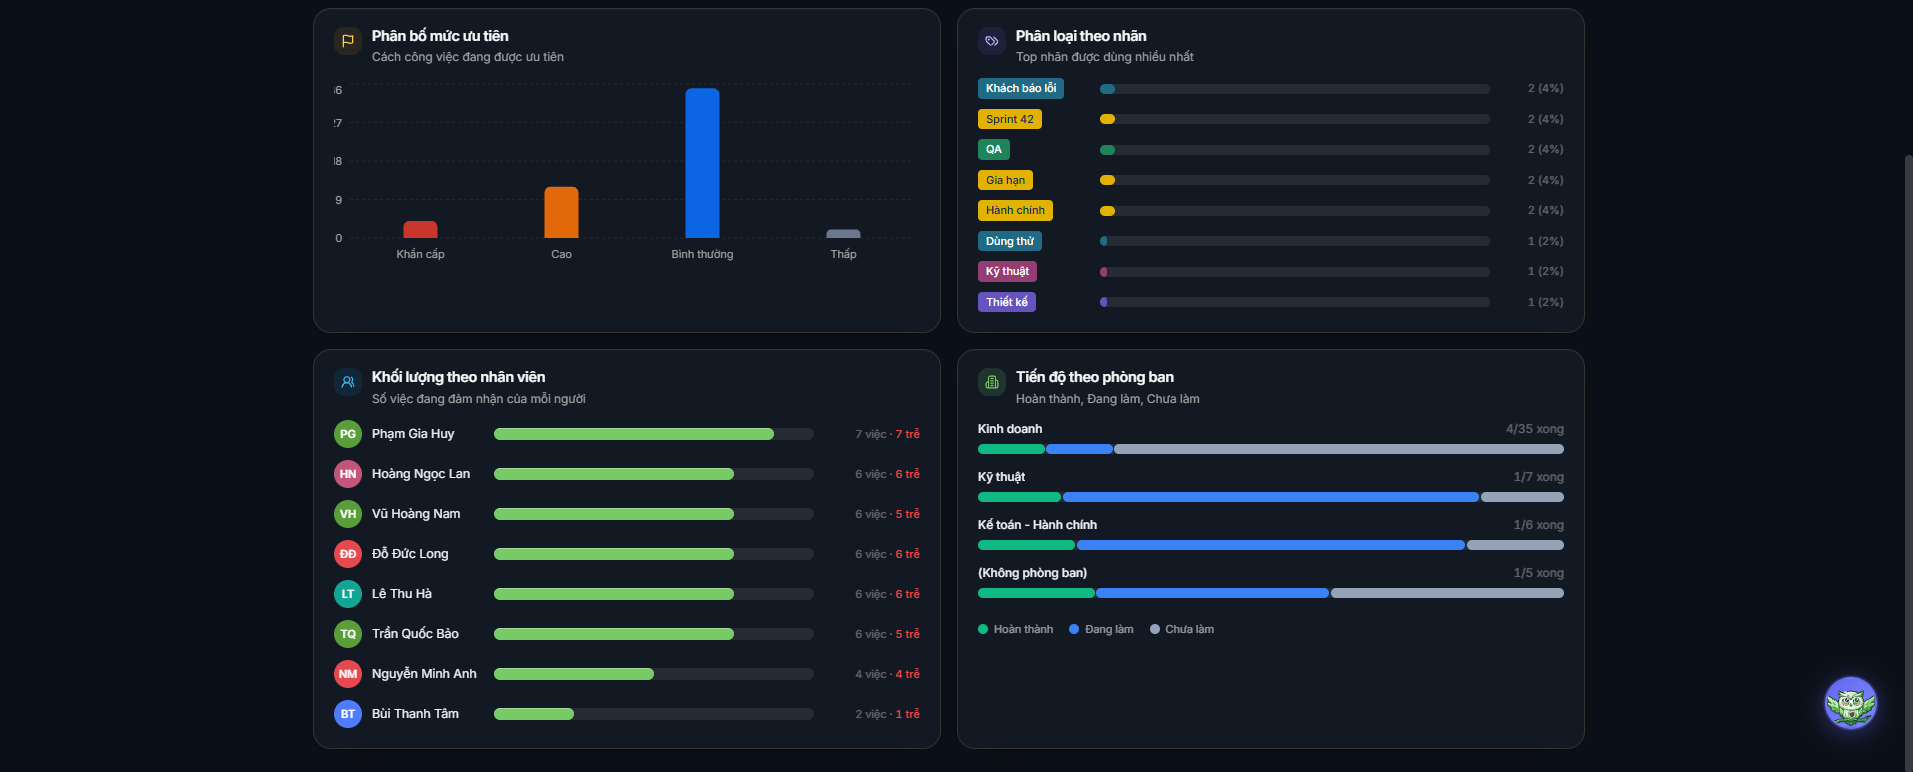
Viewing each person's workload alongside departmental progress for additional coordination context.
To build a resource gap metric or calculate your own ROI, you need agreement on the data sample, the formula, access permissions, exceptions and the evidence of financial value. Do not treat a conversion of time into money as a confirmed saving.
7. Six questions a CEO should answer before deciding to hire
One: How much has the department's actual workload grown compared with previous periods?
Two: How much time do employees spend on the activities that produce their core output, using a definition agreed with that department?
Three: Is work usually late because of a shortage of processing hours, waiting for approval, missing information, or constantly changing processes?
Four: If repetitive activity were reduced, which specific tasks could the freed-up resources be reallocated to?
Five: After the change, did output and quality improve; did overtime levels and overload risk change?
Six: Has the economic benefit been proven to be a real cost saving, new output value, or merely time converted under a model?
If a business cannot yet answer these questions, deciding to hire or cut headcount on the basis of an average digital activity ratio is far too hasty.
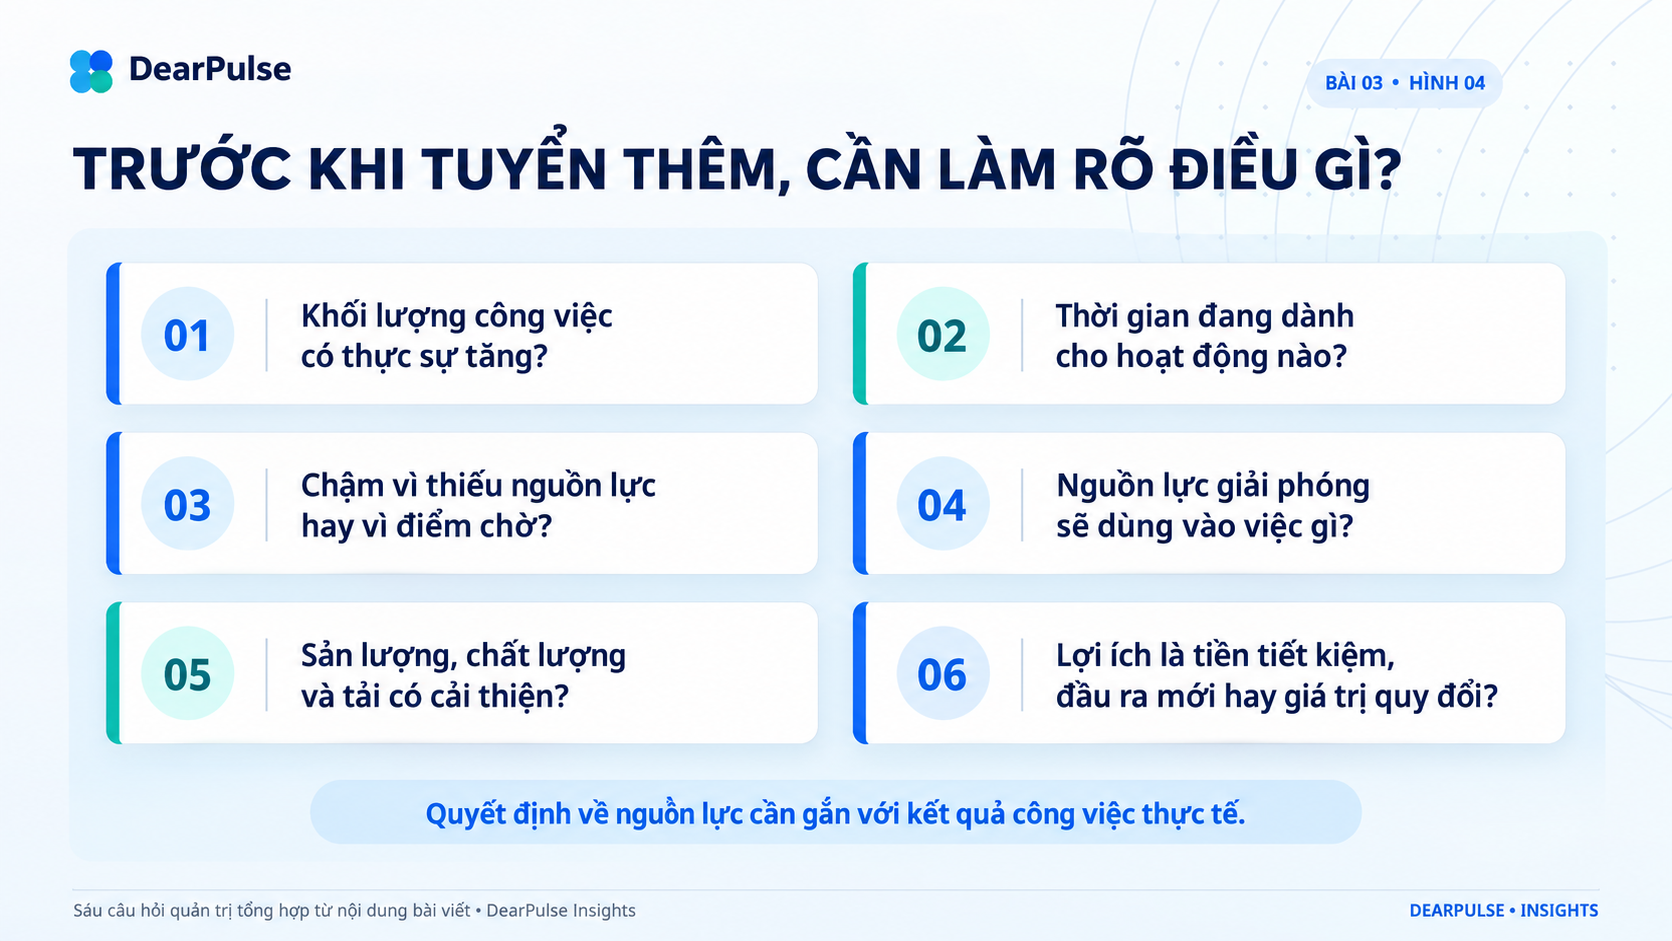
Six governance questions to clarify before deciding to hire.
Conclusion: the capacity gap is a governance question, not a ranking of people
ActivTrak's research shows a significant gap between targets and recorded productive working time among the organisations in its sample. The Parts ASAP case shows that data can be used to support a range of operational optimisation decisions, with results as published by the vendor.
But to apply any of this in Vietnam, a business has to use definitions appropriate to each role and compare them against real work results. Spare time is not automatically money lost; performance below target is not automatically the employee's fault; and a foreign benchmark is not the standard for every Vietnamese department.
DearPulse can start by helping an organisation see its work, progress and time data more clearly. The business then trials an improvement on one specific bottleneck, measures the result, and converts it into ROI only once there is evidence of the value created.
Do not start with the question "how many people do we need to cut?". Start with "which work is failing to turn into results, and what data do we have to confirm it?".
Sources and limitations
-
[1] ActivTrak, Nearly 60% of Workers Underperform, Costing $11.2M ..., 30 July 2025
-
[5] ActivTrak, How MedRisk Achieved 11x ROI with Workforce Intelligence
Scope of interpretation: "54 minutes a day" and "USD 11.2 million per 1,000 people" are results and model outputs from ActivTrak's customer base, not Vietnamese data. Do not apply the money-conversion calculation to a Vietnamese business without customer data and a validated methodology. Under no circumstances should it be used to label individuals or to make automated staffing decisions.